Tell us about your bike, your category, and the tracks you ride.
We crunch the numbers — lap times, zone splits, health metrics.
Receive a detailed report showing what the data reveals.
Think you need an expensive data logger to understand your riding? Not anymore.
If you've got an action camera with GPS — like an Insta360 or GoPro — you're already recording useful data without realising it. We can take the GPX file from your camera and turn it into a proper session analysis report.
See our FAQ for instructions on exporting GPX from your camera.
It's not the full picture — without throttle and brake sensors, we can't analyse your inputs — but it's a brilliant starting point. You'll spot patterns, find your strong corners, and know exactly what to focus on next time out.
$15 per session — you'll see what happened on track.
Every rider wants something different from their data. When you onboard, tell us three things you want to understand — braking points, corner exits, consistency, throttle application, or something else entirely. We'll shape the analysis around what matters to you.
Lap-by-lap breakdown with zone times, speed data, consistency metrics, and vehicle health check. See exactly what happened in each session.
Full track day analysis across multiple sessions. Track your progression, identify your best zones, and spot patterns throughout the day.
Focused analysis of water temp, oil pressure, battery voltage, and AFR. Know your bike is happy before something goes wrong.
Requires water temp, oil pressure, lambda, and voltage sensors connected to your data logger. We'll confirm what's possible based on your setup during onboarding.
We present the data. You draw the conclusions.
This is a data analysis service, not coaching. We don't tell you what to do differently — we show you what the numbers say.
Real data from a practice session at Phillip Island. This is the kind of detail in every report.
Where's the time going? What do my braking habits look like, and am I getting on the throttle well on corner exit? Is my bike happy?
Here's what the data showed.
Phillip Island GP Circuit • Practice Session • Dry with damp patches
| Zone | Name | Session Best | PB | Delta |
|---|---|---|---|---|
| Z1 | Doohan | 6.90s | 6.95s | -0.05s ✓ |
| Z2 | Southern Loop | 10.00s | 9.65s | +0.35s |
| Z3 | Stoner | 13.65s | 12.75s | +0.90s |
| Z4 | Miller | 9.50s | 8.70s | +0.80s |
| Z5 | Siberia | 14.65s | 15.00s | -0.35s ✓ |
| Z9 | Turn 11 | 17.30s | 16.10s | +1.20s |
What the data shows: Despite damp patches, Siberia (Z5) and Doohan (Z1) were actually faster than the dry PB. The biggest gap is Turn 11 — that's where the time is hiding.
Throttle pickup analysis • Comparing laps to find the difference
| Lap | Zone Time | Exit Speed | Lean at Throttle Open |
|---|---|---|---|
| Lap 1 ★ | 17.30s | 117.6 km/h | 0.89g |
| Lap 2 | 17.80s | 112.5 km/h | 0.59g |
| Lap 3 | 17.80s | 112.4 km/h | 0.70g |
| Lap 4 | 17.40s | 114.5 km/h | 0.81g |
The key insight: On Lap 1, throttle was picked up while still at 0.89g lean — committed to power while leaned over. On slower laps, the rider waited until more upright (0.59–0.70g) before opening throttle. Result: 5 km/h difference in exit speed, which compounds down the entire front straight.
We work with racers and track day riders across Australia. Here's who's using the data.

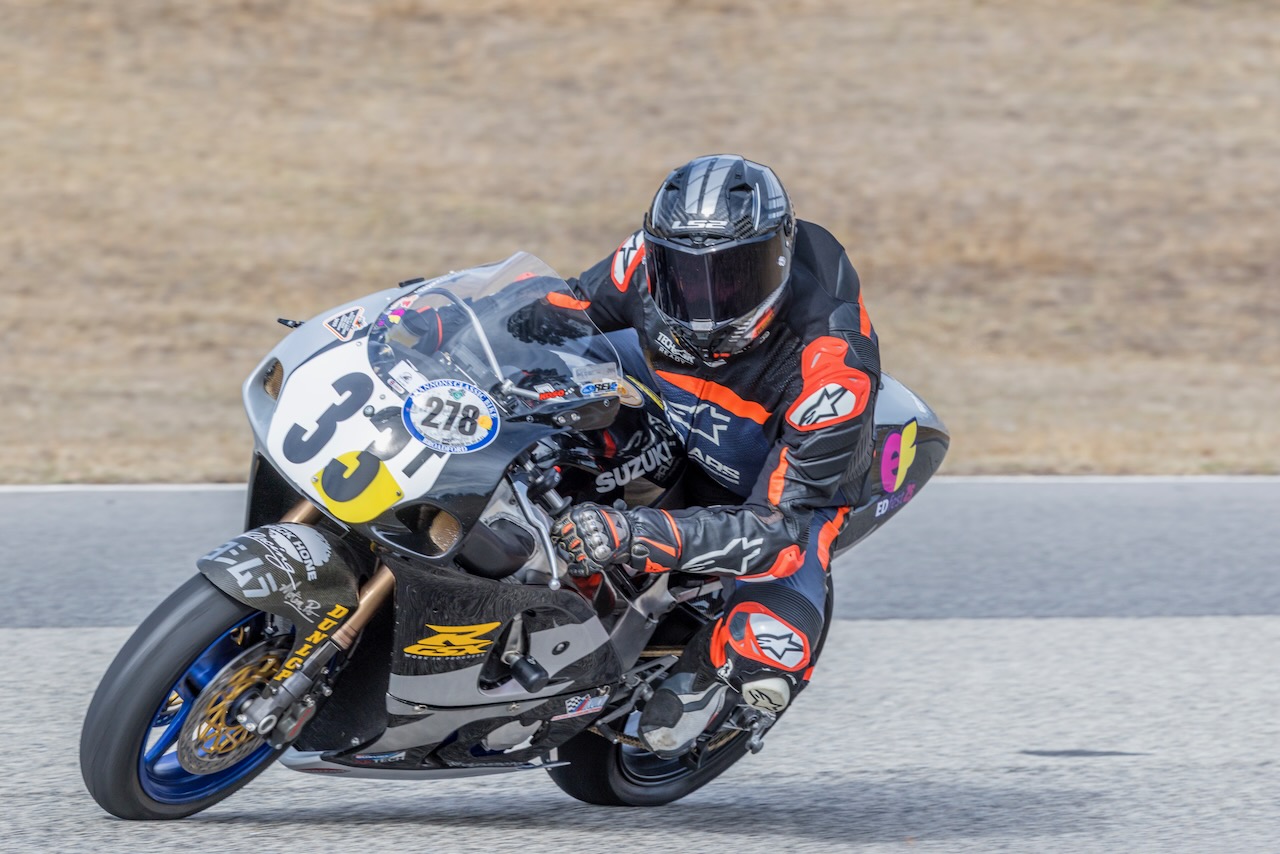
333 Classic SBK Racing
Suzuki GSXR 750 SRAD
1996
Period 7 Superbike
Phillip Island, Broadford
Factory radiator, Stage 2 cams, ported head, high comp pistons, Carrillo rods, Öhlins rear shock, K6 swingarm
Fill out the form and we'll get you set up. First analysis is on us.
Get Started